reader10 min read

Overfitting and Curve-Fitting

Overfitting (curve-fitting) is tuning a system's parameters and rules to fit the noise in a specific historical sample so closely that it captures the past's accidents rather than a repeatable edge.

Target audience: Traders who optimise parameters until the backtest looks great and then watch it fail in real time.

Learning objectives

  • Explain how added parameters let a system memorise noise.
  • Spot the warning signs of an overfit system.
  • Prefer fewer parameters and robustness over a perfect in-sample fit.
  • Use parameter sensitivity as a robustness check.

Definition

Overfitting (curve-fitting) is tuning a system's parameters and rules to fit the noise in a specific historical sample so closely that it captures the past's accidents rather than a repeatable edge.

Why it matters

Overfitting is the reason most backtests fail live. With enough parameters you can fit any history perfectly, and the prettier the in-sample curve, the more likely you have memorised noise. Recognising and resisting curve-fitting is the difference between a system that travels to the future and one that only ever worked on the data it was built on.

Why more knobs fit more noise

Every adjustable parameter and every added rule is a degree of freedom that lets the system bend to the specific past. With enough of them you can reproduce any equity curve, including one made entirely of luck. The fit you see in-sample is then a mixture of real edge and memorised noise, and the more knobs you turned, the larger the noise share. Simplicity is not aesthetic preference; it is a defence against fitting randomness.

Warning signs

An overfit system tends to show: a suspiciously smooth equity curve, excellent results that collapse if a parameter moves slightly, many rules each justified by a few past trades, and parameter values that sit on a narrow peak rather than a broad plateau. If changing your moving-average length from 20 to 22 wrecks the result, you have not found an edge; you have found a coincidence that happens to like 20.

Robustness over perfection

A robust system is one whose edge survives reasonable changes: different parameters in a neighbourhood, different instruments, and different time periods all still work, just not as prettily. Prefer the broad plateau to the sharp peak. Cap the number of parameters, justify each rule by a mechanism (why should this work?) rather than by its backtest contribution, and accept a worse in-sample number in exchange for an edge that is likely to repeat.

Visual models

Process-outcome matrix: judge the decision, not the result; the lucky win is the trap
Process-outcome matrixA two-by-two matrix of process quality against trade outcome: a good process winning or losing should be repeated, a bad process losing should be fixed, and a bad process that wins is a dangerous lucky win to flag rather than celebrate.LOSSWINGOODBADprocessEarned winRepeat itCorrect lossVariance, repeat itDeserved lossFix the ruleLucky winDanger: do not repeatthe trapoutcome

Worked examples

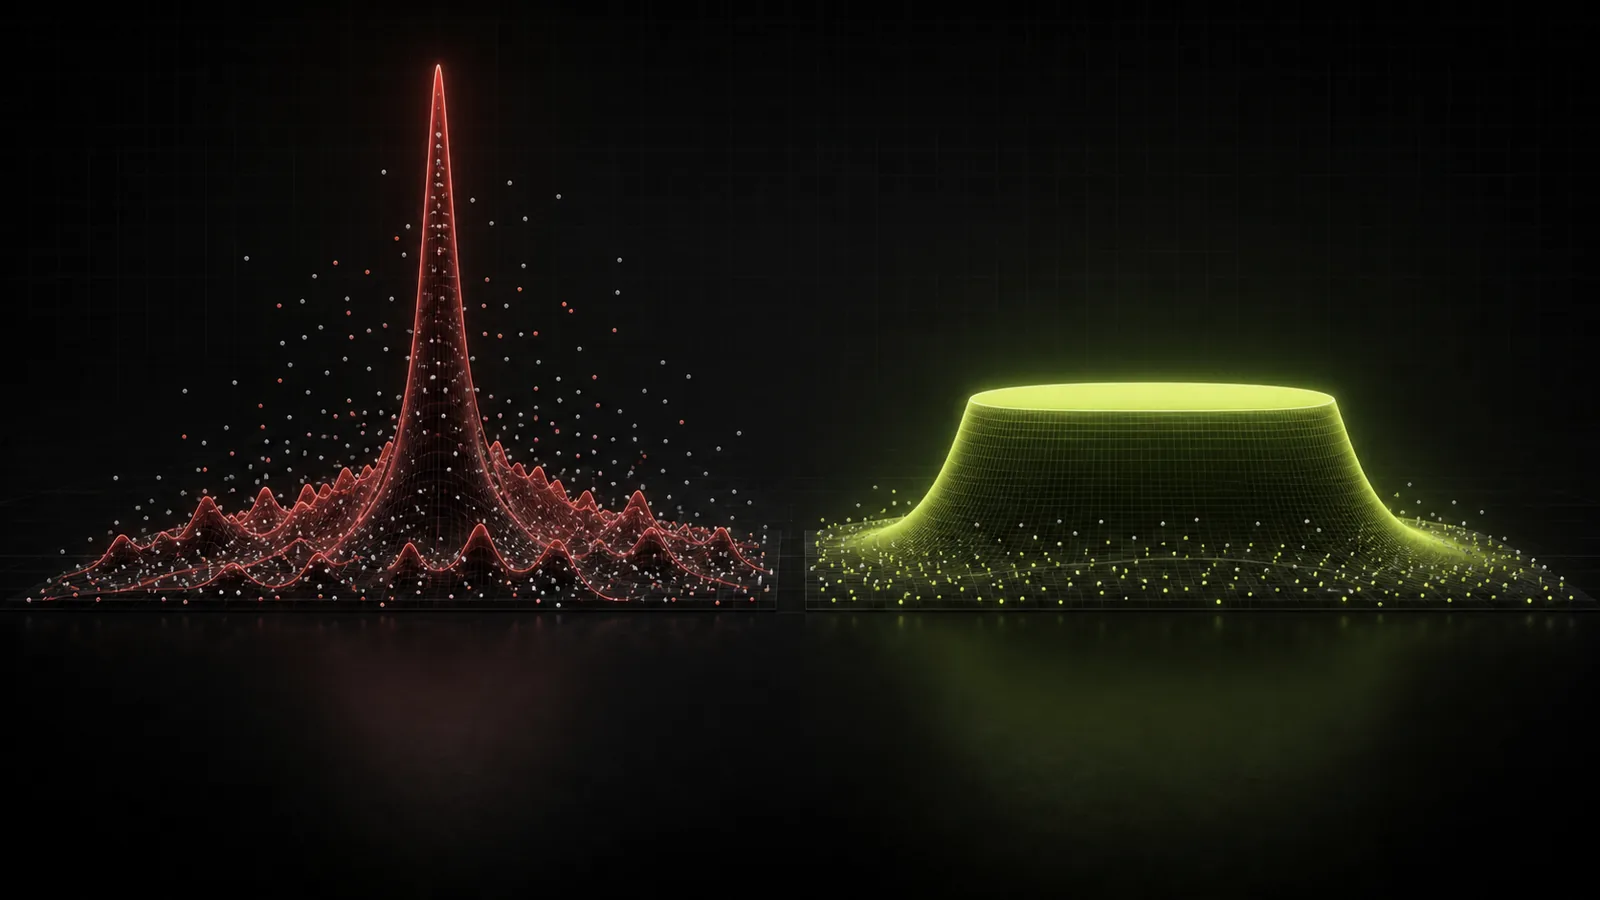
Example 1: Peak versus plateau

Optimising a lookback from 5 to 50, system A peaks sharply at length 13 (expectancy +0.6R) and is negative at 11 and 15. System B is positive and similar across 18 to 30 (expectancy +0.25R, flat). A's headline number is better, but it sits on a needle: live, the future will not land exactly on 13. B's broad plateau is the real edge, because it does not depend on the past's exact accidents.

Common mistakes

Adding rules until the past equity curve looks perfect.

Optimising many parameters on one sample and reporting that sample as the result.

Choosing a parameter on a sharp peak instead of a broad plateau.

Justifying a rule by its backtest contribution rather than a real mechanism.

Re-optimising after every drawdown, chasing the noise further.

Myth vs reality

Myth

That a better in-sample fit means a better system.

Reality

No paired reality note provided.

Myth

That more rules and parameters make a system more robust.

Reality

No paired reality note provided.

Myth

That a smooth historical equity curve is a good sign.

Reality

No paired reality note provided.

Risk considerations

  • Overfit systems fail precisely when trusted with size, because confidence was built on noise.
  • Re-optimising live turns one overfit into a sequence of them.

Practice exercises

1. Stress-test your parameters

Take a tuned system and check whether its edge survives small parameter changes.

  1. Pick the most important parameter and vary it within a reasonable neighbourhood.
  2. Plot expectancy across the range and look for a plateau, not a peak.
  3. Count the total parameters and remove any rule with no real mechanism.
  4. Prefer the robust, flatter configuration even if its peak number is lower.

Quiz

Q1. What is overfitting in a trading system?

Q2. Why prefer a parameter plateau to a sharp peak?

Q3. What is a warning sign of an overfit system?

Next lesson

Walk-Forward and Out-of-Sample Testing

This lesson is educational content only and is not financial advice. Trading involves substantial risk. A tested process improves decision quality and survivability; it does not predict the market or guarantee any outcome. Trade only with risk you can afford to lose.