A single luminous lime candlestick reveals open high low and close
Delta-X Academy

How to Read a Candlestick

Original Delta-X illustration.
free8 min read

A candlestick summarises price over a fixed period using four values: the open, the high, the low, and the close. The body spans the open and close, and the thin wicks reach to the high and low. Its colour shows whether price finished above or below where it started.

Target audience: New traders who want to read a price chart from the ground up before touching any indicator.

Learning objectives

  • Name the four prices every candlestick encodes.
  • Distinguish the body from the wicks and explain what each shows.
  • Interpret long wicks as rejection of a price area.
  • Read a short sequence of candles as a story rather than isolated bars.

Definition

A candlestick summarises price over a fixed period using four values: the open, the high, the low, and the close. The body spans the open and close, and the thin wicks reach to the high and low. Its colour shows whether price finished above or below where it started.

Why it matters

Every chart you will ever read is built from candlesticks, so reading one correctly is the foundation of all technical analysis. A trader who can decode a single candle and then a short sequence of them already sees more than someone watching a line that only plots the close, because the candle preserves the fight between buyers and sellers inside the period.

The four prices in every candle

A candlestick covers one period, whether that is one minute, one hour, or one day. It records four prices: the open (where the period began), the close (where it ended), the high (the furthest price up), and the low (the furthest price down). The rectangular body connects the open and close. If the close is above the open the candle is usually drawn light or green; if below, dark or red. The thin lines above and below the body are wicks, also called shadows, and they reach to the high and the low.

What the body and wicks tell you

A long body means price moved decisively from open to close, so one side dominated the period. A small body means the open and close finished close together, which signals indecision. Wicks show where price went but could not stay. A long upper wick means buyers pushed price up and then sellers forced it back down before the close, which is rejection of higher prices. A long lower wick is the mirror image: sellers pushed down and buyers reclaimed the level. Wicks often matter more than bodies because they mark areas the market refused to accept.

Reading candles in sequence

A single candle is a word; a sequence is a sentence. Three long green bodies in a row say buyers are in control. A long green candle followed by a small indecisive one says the move may be tiring. A long lower wick at the bottom of a decline says sellers tried to push lower and failed. You do not need to memorise named patterns to benefit from this. Just ask, for each candle, who won the period and whether conviction is building or fading, and the chart starts to read like a narrative.

Visual models

Price-context map: judge the setup only after location, range, and invalidation are known
Price context mapThe chart maps higher-timeframe supply and demand, the midpoint chop area, a pullback low, a decision zone near range high, and invalidation below structure.decision zonerange high / supplyrange low / demandmidpoint: no edgepullback lowinvalidation belowContext checklistTrend leg aligns with locationInvalidation visible before entrydemandsupplytriggerRHRLpricecontext first, trigger second

Worked examples

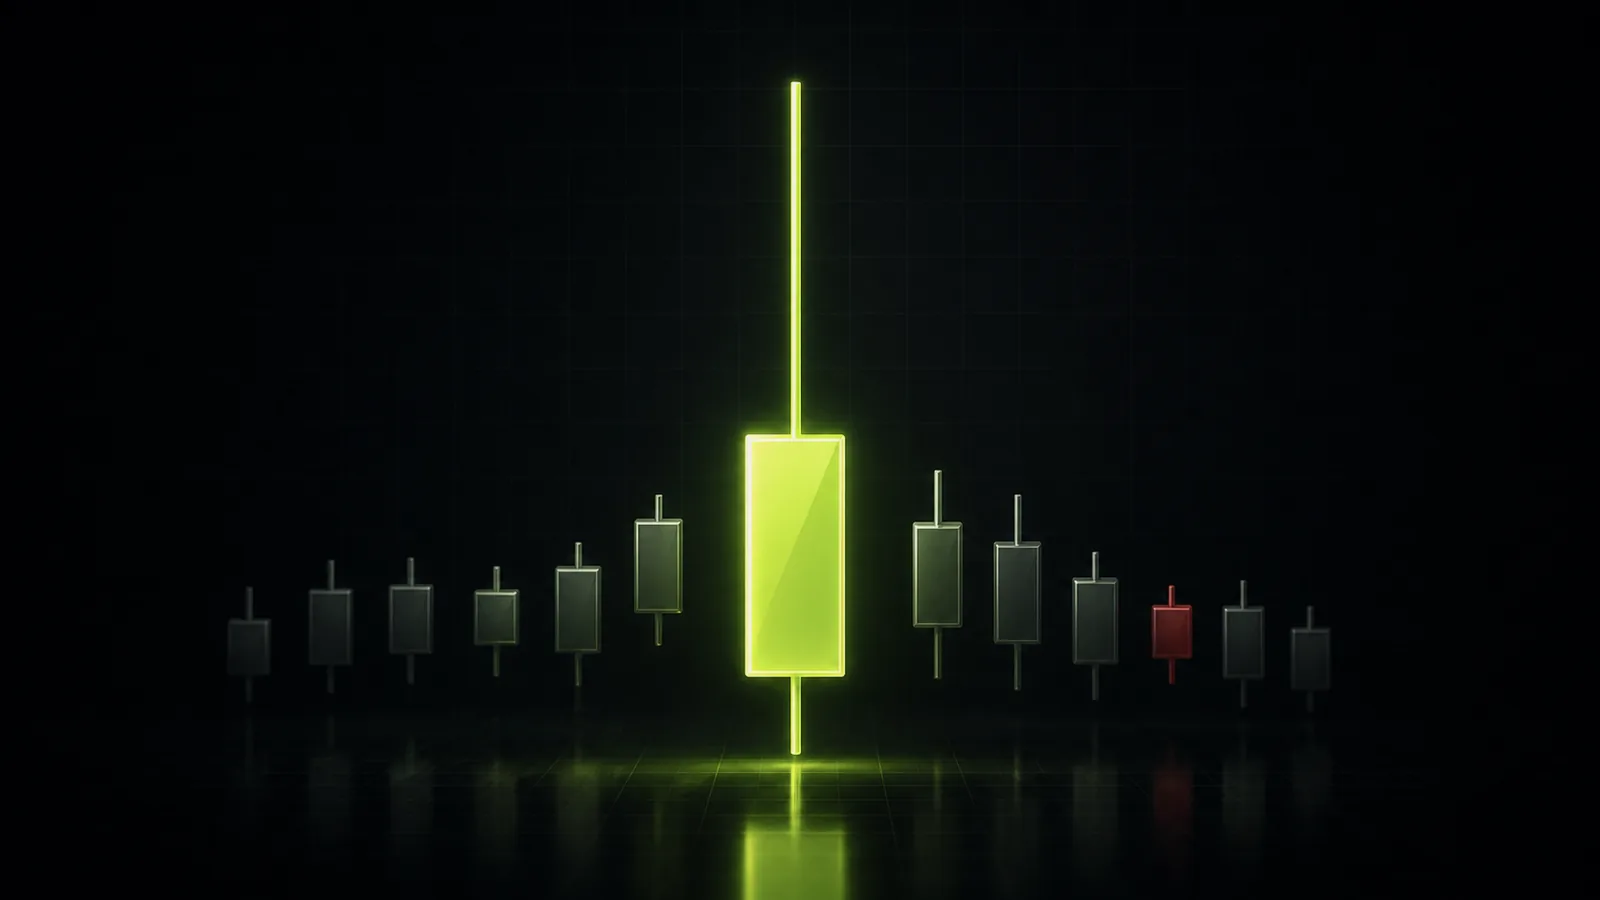
Example 1: A rejection candle at a high

Price has rallied for an hour and prints a candle that opens at 100, spikes to 104, then closes back at 100.5 with only a small body and a long upper wick. The buyers who chased 104 are now underwater, and the long upper wick records their failure to hold it. Without naming any pattern, you can read the period as a rejection of higher prices. That single candle is more informative than a line chart, which would only show the 100.5 close and hide the 104 spike entirely.

Common mistakes

Reading only candle colour and ignoring the size of the body and wicks.

Treating one candle as a signal instead of reading it in context.

Forgetting that a candle's meaning depends on its timeframe.

Memorising pattern names without understanding the buyer-versus-seller story.

Ignoring wicks, which often mark the most important rejected prices.

Myth vs reality

Myth

That a green candle is bullish regardless of where it forms.

Reality

No paired reality note provided.

Myth

That the body matters and the wicks are noise.

Reality

No paired reality note provided.

Myth

That candlestick patterns predict the next move on their own.

Reality

No paired reality note provided.

Risk considerations

  • A single candle is a weak basis for a trade; it gains meaning only with context.
  • The same candle on a one-minute and a daily chart carry very different weight.

Practice exercises

1. Decode ten candles

Open any liquid market on an hourly chart and read ten consecutive candles out loud without using pattern names.

  1. For each candle, identify the open, high, low, and close.
  2. State whether the body is large or small and what that says about conviction.
  3. Note any long wick and which side was rejected at that extreme.
  4. Summarise the ten candles as one sentence about who is in control.

Quiz

Q1. What four prices does a candlestick encode?

Q2. What does a long upper wick usually indicate?

Q3. Why can a candlestick chart be more informative than a line chart?

Next lesson

Timeframes and Multi-Timeframe Analysis

Continue to next

This lesson is educational content only and is not financial advice. Charts and indicators describe what price has already done; they do not predict the future or guarantee any outcome. No indicator works in every market or timeframe. Trading involves substantial risk, and you should trade only with risk you can afford to lose.