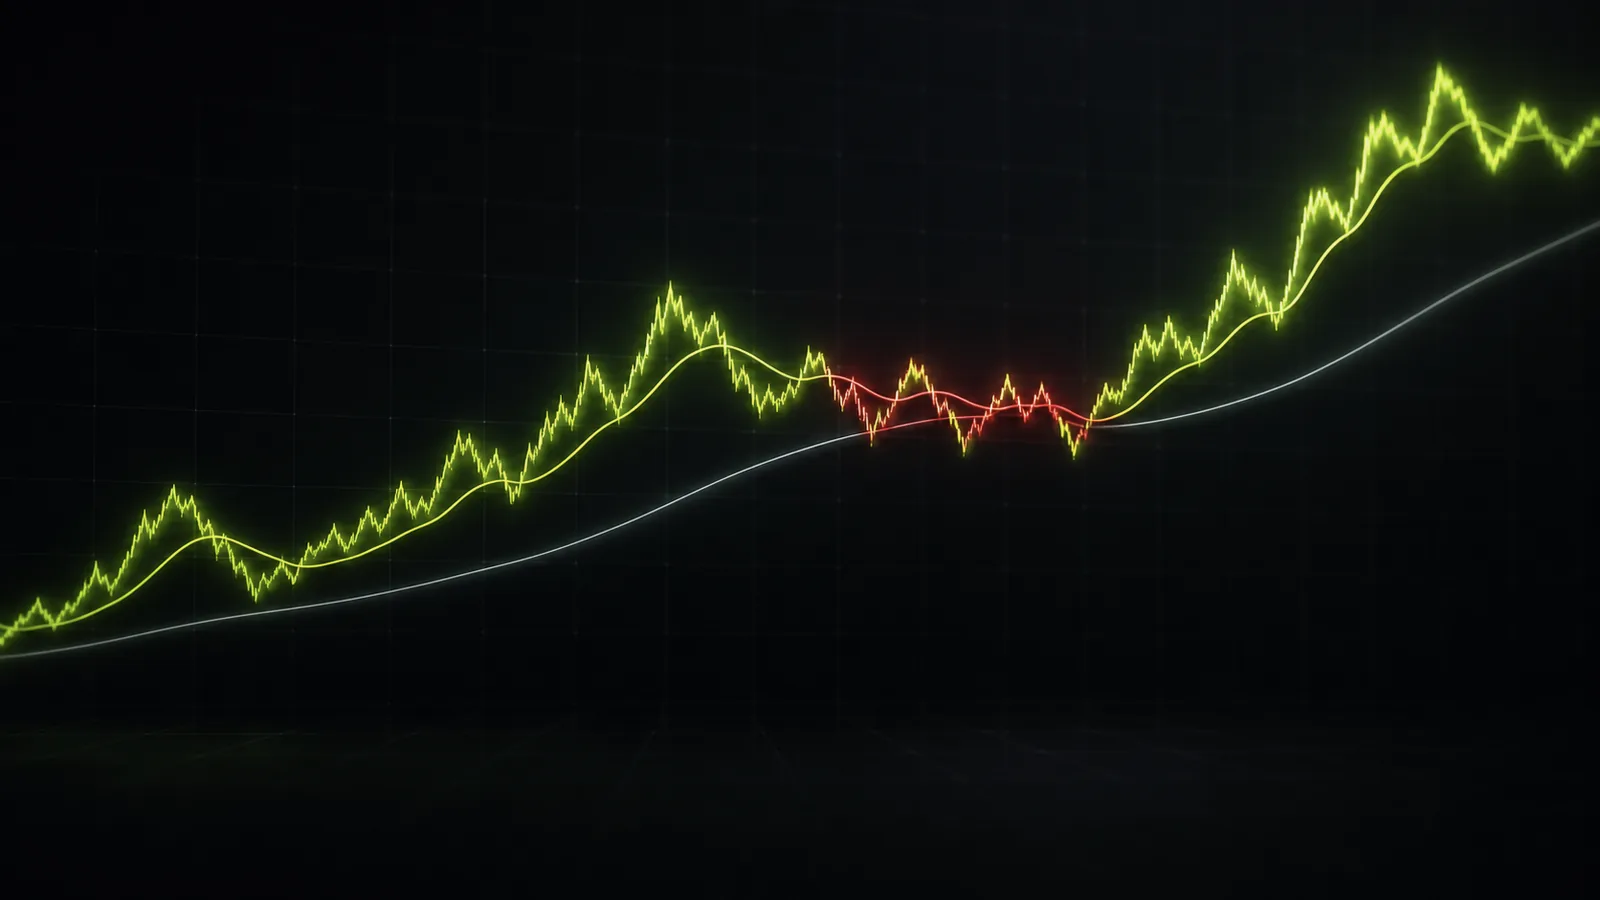
A price line threads between fast and slow moving averages with a whipsaw cluster
Delta-X Academy

Moving Averages

Original Delta-X illustration.
free9 min read

A moving average is the average price over a set number of recent periods, recalculated each period so it slides along with price. It smooths the noise of individual candles into a single line that summarises the recent trend, and it always lags price because it is built from the past.

Target audience: Traders adding their first indicator who want trend context without trading every crossover.

Learning objectives

  • Explain how a moving average is calculated and why it lags.
  • Distinguish a simple from an exponential moving average.
  • Use a moving average for trend context rather than as a signal.
  • Recognise why moving-average crossovers whipsaw in ranges.

Definition

A moving average is the average price over a set number of recent periods, recalculated each period so it slides along with price. It smooths the noise of individual candles into a single line that summarises the recent trend, and it always lags price because it is built from the past.

Why it matters

Moving averages are the most widely used indicator, which makes them worth understanding even if you never trade them directly, because so many participants watch the same lines. Used well they give quick trend context and dynamic levels; used badly they generate constant whipsaw signals in ranging markets. Knowing the difference between context and signal is what separates the two outcomes.

How it is built and why it lags

A twenty-period simple moving average is the average of the last twenty closes, redrawn each period. Because it is an average of past prices, it always trails the current price: it tells you where the centre of recent action sits, not where price is going. The longer the period, the smoother and slower the line; a fifty or two-hundred period average reacts slowly and reflects the larger trend, while a ten-period average hugs price closely and reacts fast but noisily.

Simple versus exponential

A simple moving average weights every period equally. An exponential moving average weights recent periods more heavily, so it turns faster and tracks price more closely. Neither is better in the abstract: the exponential responds sooner, which helps in trends and hurts in chop, while the simple is steadier and is the version many widely watched levels, such as the two-hundred day, are quoted in. Pick one deliberately and know which you are using, rather than switching to whichever happens to fit the last move.

Context, not a signal

The reliable use of a moving average is as trend context and a dynamic level. Price above a rising long-period average is a simple, objective statement that the trend is up, and pullbacks to the average often find support in a trend. The unreliable use is mechanical crossover trading, where you buy when a fast average crosses above a slow one. In a trend this can work, but in a range the averages cross back and forth constantly, generating whipsaw losses. The average describes the trend well; it times entries poorly.

Visual models

Moving averages: a fast and slow mean tracking price, lagging at the turns
Moving averages chartA noisy price line with a fast and a slow simple moving average computed from it. Price weaves above and below both averages, the slower average lags further behind and price dips through it on the pullback, and the two averages converge and cross during the sideways range, producing whipsaw.11311010610399price above MAs1pullback through the MAs2crossover whipsaw3PriceFast MA (4)Slow MA (9)fastslowpricetime

Worked examples

Example 1: The whipsaw in a range

A trader uses a ten and thirty period crossover system. In a clean uptrend it catches the move and looks brilliant. Then the market ranges for three weeks, and the two averages cross back and forth nine times, each crossover a small loss as price chops sideways. The system did not break; it met the condition it cannot handle. The same trader using the thirty period only as trend context, and not trading the crossovers, would have simply stood aside during the range.

Common mistakes

Trading every moving-average crossover regardless of market condition.

Expecting a lagging average to call tops and bottoms.

Switching between simple and exponential to fit the last trade.

Using a period so short the line just retraces price and adds nothing.

Treating a pullback to the average as guaranteed support.

Myth vs reality

Myth

That a moving average predicts where price is going.

Reality

No paired reality note provided.

Myth

That crossover systems work in all market conditions.

Reality

No paired reality note provided.

Myth

That a longer average is always better than a shorter one.

Reality

No paired reality note provided.

Risk considerations

  • Crossover signals whipsaw badly in ranging markets and bleed capital.
  • An average is a lagging line; it confirms a trend late and reverses late.

Practice exercises

1. Context versus crossover

Add one long and one short moving average to a chart and compare context use against crossover use.

  1. Mark where price sat above and below the long average and label the trend.
  2. Mark every crossover of the two averages over the visible range.
  3. Count how many crossovers happened during trends versus ranges.
  4. Decide which use, context or crossover, you would trust and why.

Quiz

Q1. Why does a moving average always lag price?

Q2. How does an exponential moving average differ from a simple one?

Q3. Why do moving-average crossovers whipsaw in ranges?

Next lesson

VWAP: The Volume-Weighted Average Price

Continue to next

This lesson is educational content only and is not financial advice. Charts and indicators describe what price has already done; they do not predict the future or guarantee any outcome. No indicator works in every market or timeframe. Trading involves substantial risk, and you should trade only with risk you can afford to lose.